
Scholarly Commons @Augusta University
This guide offers information regarding the Augusta University institutional repository, Scholarly Commons.
Google Analytics is a website tool that tracks the behavior of IP addresses on the Scholarly Commons Website. These reports can show the overall reach and activity of Scholarly Commons. These reports are only available to Scholarly Commons Administrators but may be made available upon request.
This report, from the 2014-2015 yearly review, shows a significant increase in new visitors over the 2013-2014 report. The average session duration has not changed much, about two minutes, suggesting quick browsing or visits prompted through Google Scholar search results. To continue increasing the session durations, number of sessions, and page views, the repository will need to continue to grow. For more specific data on collections and items within the repository please contact Kim Mears or Sandra Bandy.
A complete explanation of the terms used is available in the right column. The original pdf is available for download at the top of this box as well as the pdf for the 2013-2014 analytics.
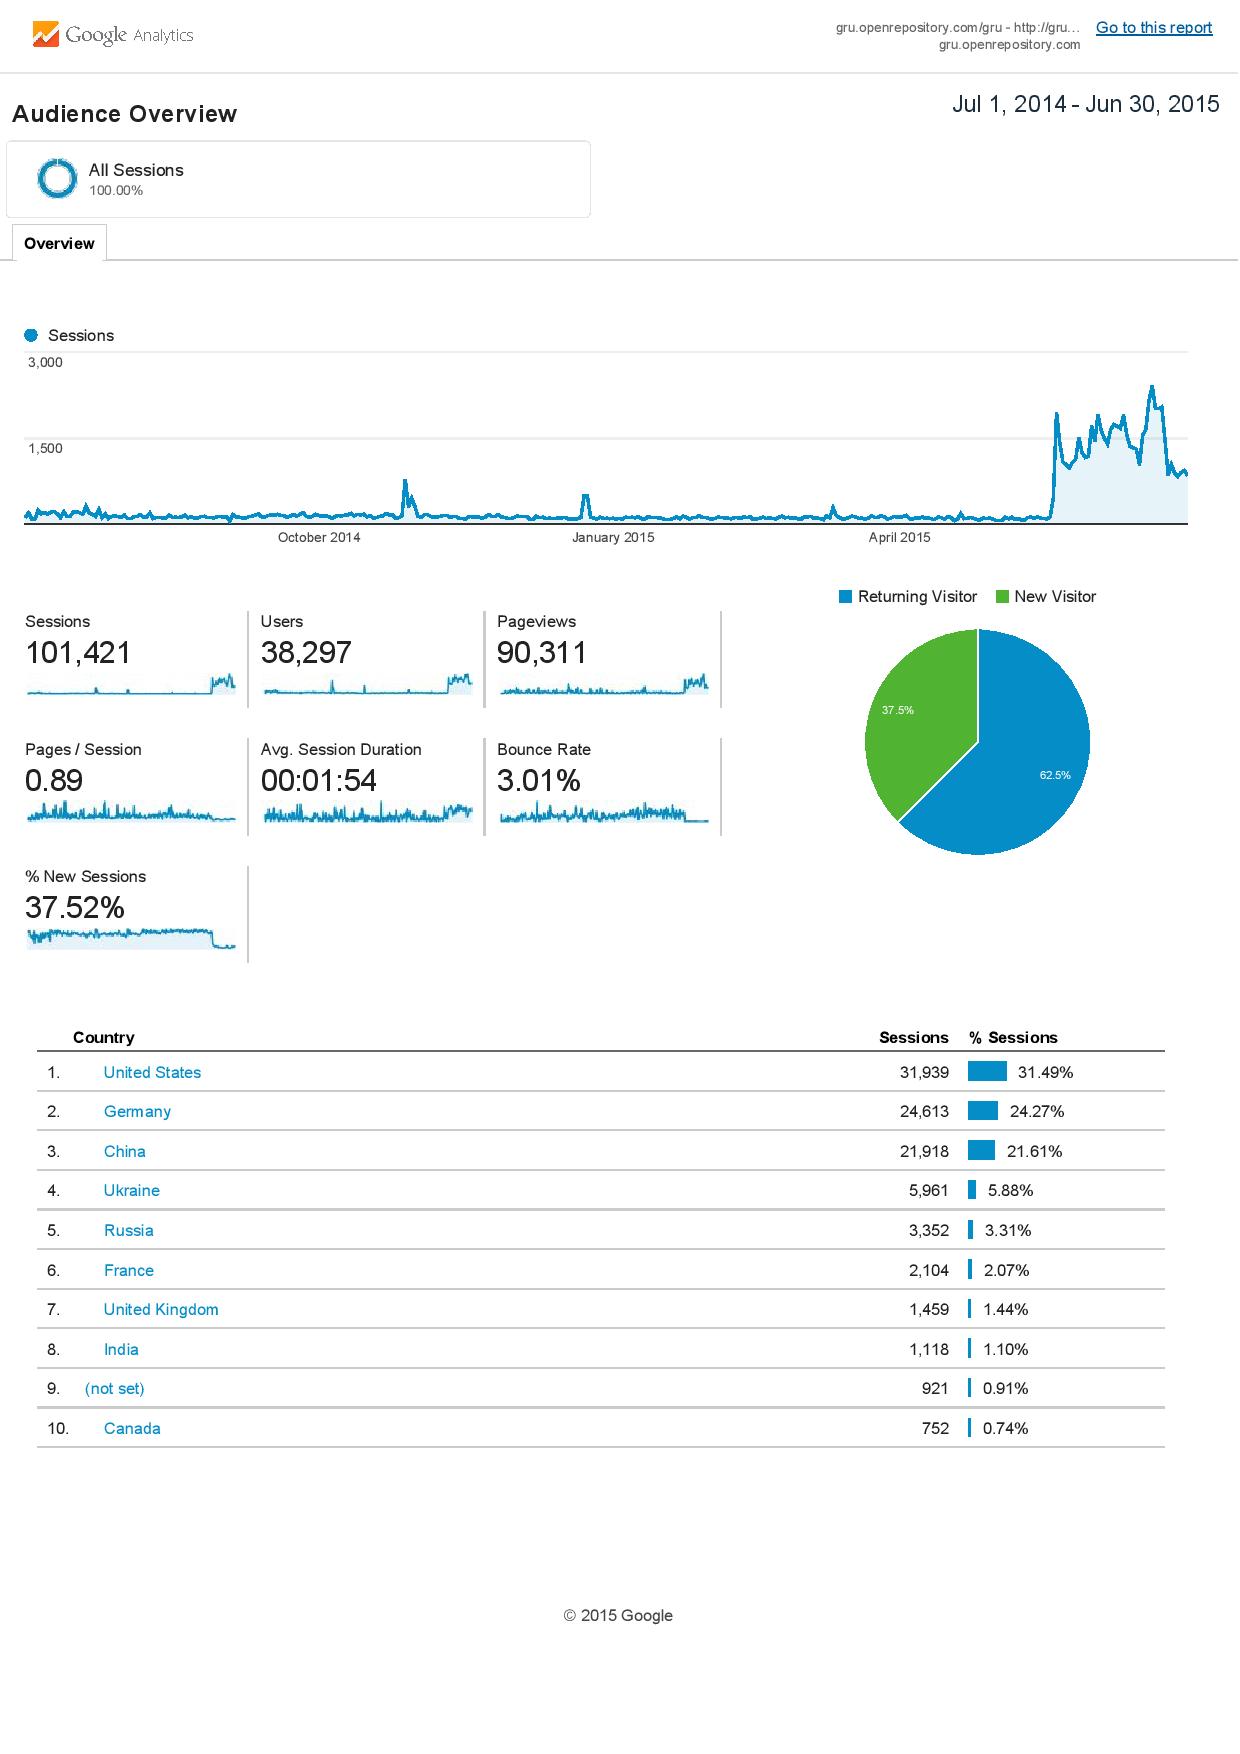
Sessions
Sessions refer to when a user accesses the site regardless of the number of pages the user visits or the length of the visit.
Users
This tracks the number of unique IP addresses that access the site.
Pageviews
The number of times users viewed any pages, repeated visits to the same page are included.
Pages / Session
This can also be understood as "pages per session." This averages the number of unique pages viewed durring a session. Repeated visits to a single page are not counted.
Avg. Session Duration
The average time a visitor spent on the site.
Bounce Rate
The percentage of single-page visits (i.e. visits in which the person left the site from the entrace page without interacting with the links or search box)
% New Sessions
An estimation of the percentage of first-time visits.